|
|
FLASH AMR
I developed a couple of simple VTK applications to interactively visualize AMR (adaptive mesh refinement) data from FLASH simulations. These two tools were used to look at a 128^3 test problem that the NCSA Cosmological Simulation Group ran on NCSA supercomputers. The test problem is related to the formation of clusters of galaxies. More information on the science at Paul Ricker's homepage
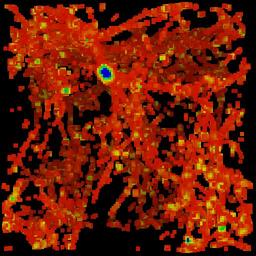 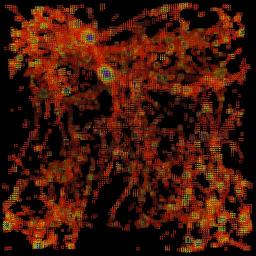
The first tool is a point renderer that allows you to interactively visualize the AMR FLASH dataset. Modern graphics hardware can render large numbers of points at interactive speeds. The images above are not that interesting. It is by rotating the data that you begin to understand the structure. The tool allows you to vary the point size and the threshold. Smaller point sizes (above right) allow you to look within the volume whereas large point sizes (above left) more clearly show the structure of the data.
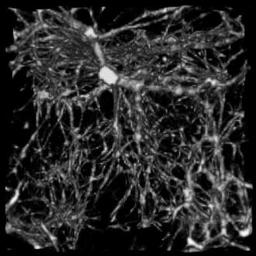 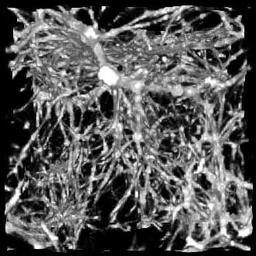
The second tool makes use of two VTK volume rendering techniques to look at the
data. In order for this to work, the AMR data has to first be resampled to a
regular grid (vtkStructuredPoints) as that is what VTK expects for its
volume rendering filters. Again, this is an interactive tool that allows you
to rotate the data at reasonable framerates.
|
This is an archive of my NCSA website from 2003
Visit my new homepage